
Project
Castaway Riches
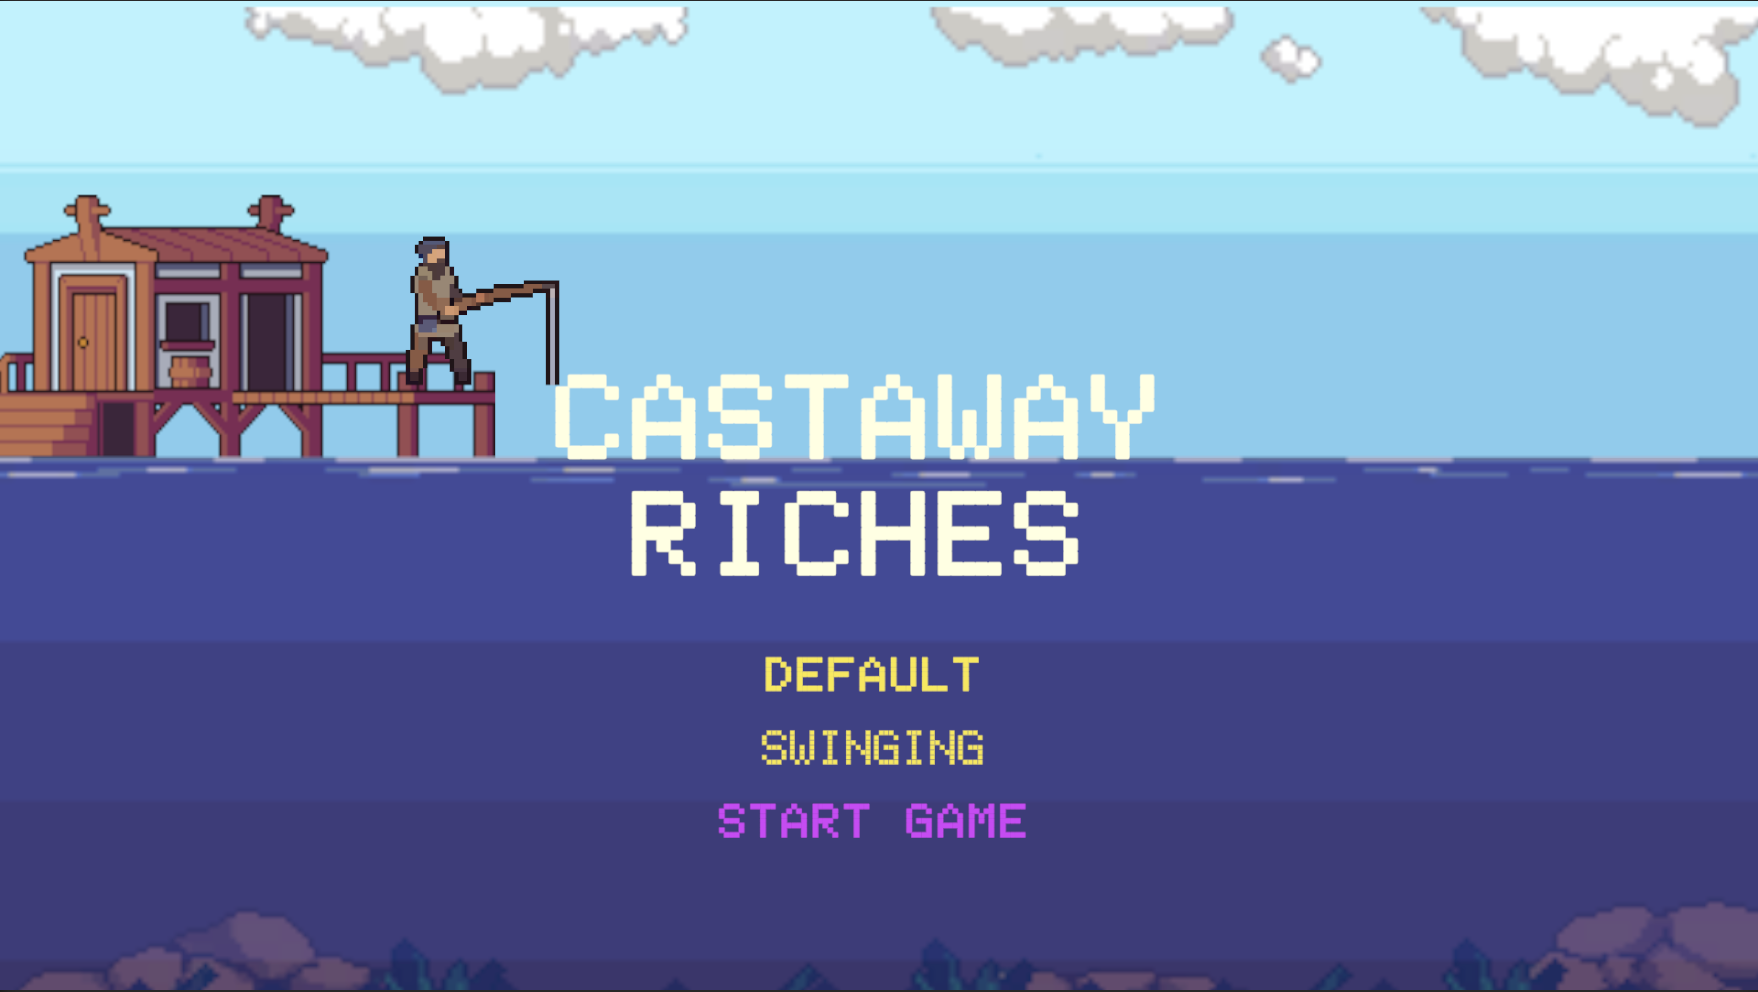
Castaway Riches is a fishing-themed casual arcade game that offers a twist from traditional fishing games; by incorporating various unique mechanics, varieties of fish, and an endless mode, Castaway Riches aims to deliver a continuously engaging experience to players.
During this project, I led a team of three to created this game. We designed the game under the guidance of the MDA framework and the Formal Elements, and I collected game spritesheets and images from Itch.io. We implemented our game using Unity and C#; with these tools, we created 2 different game scenes and 8 unique animations within the two scenes and hanled multiple types of movements and interactions.
Learn more from the game design document:
Castaway Riches Game Design Document
See the game demo:
Castaway Riches Game Demo
Try out the game by cloning code from github repo:
Castaway Riches Game Code Github Repo
National Geographic Cover & Climate Change
National Geographic is a scholarly journal that publishes monthly issues on stories related to geography, innovation, archaeology, human development, and changes in environment. Due to the evolution of the scholarly journal, we wanted to see the evolution of the issues by examining its cover images. With the rise of climate change, we sought to investigate whether the cover images of the last 40 years corresponded to the changes of environment overtime.
During this project, I employed my skills in R and Tableau to create data visualizations and word cloud to explore our data and foster following steps. I also helped the team to conduct probit model to test our result.
Learn more of the project from the presentation slides: National Geographic Cover & Climate Change
Gun Violence in US (1982 - 2023)
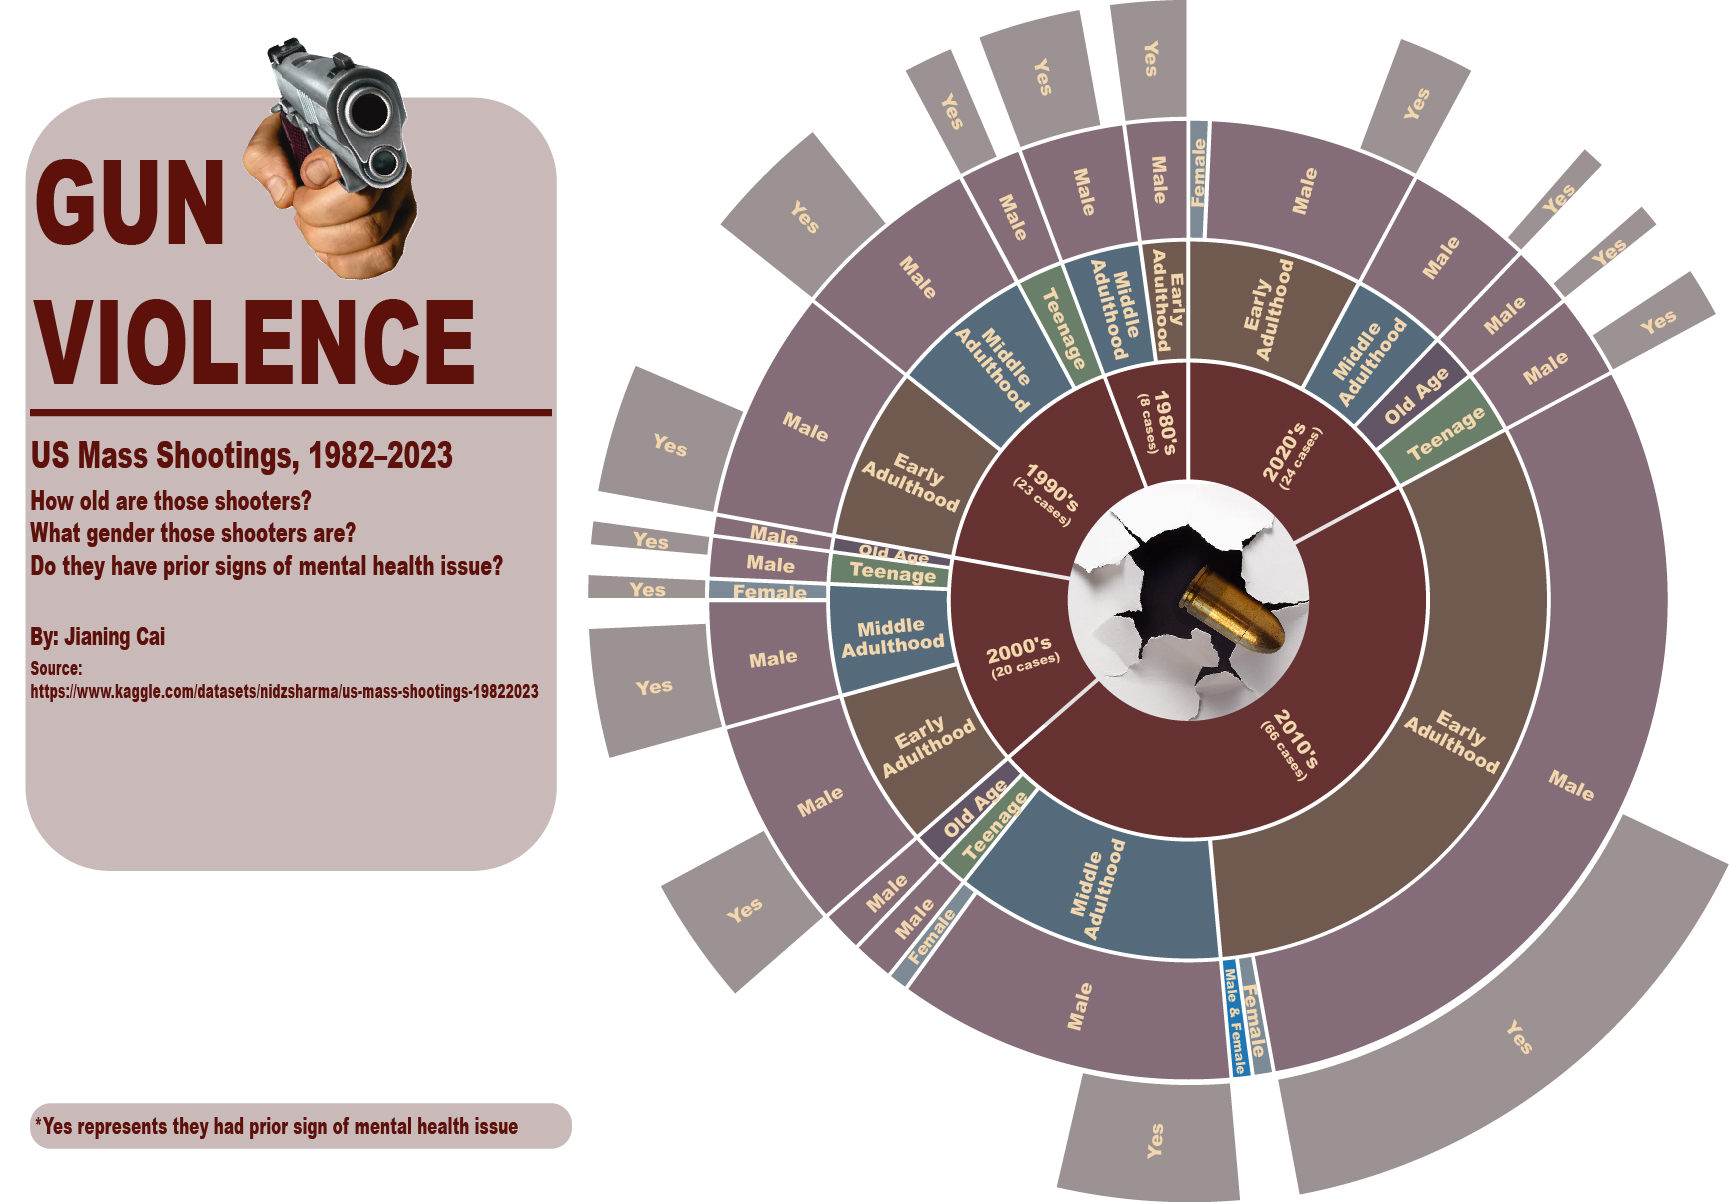
Since 1982, the United States has witnessed a significant number of tragic mass shootings. This project leverages a dataset obtained from Nidhi Sharma to create a user-friendly and visually appealing platform for individuals to gain insights into these incidents over the years. The project's primary focus is to provide detailed information on the shooters' demographics, including their age and gender, as well as their mental state. Additionally, the project highlights the various locations where these tragic events occurred. I created a sunburst chart using Tableau and Adobe Illustrator as my poster. I also created a observable notebook as an interactive project website which contains interactive map created by D3.
Learn more of the project from the observable notebook: Gun Violence in US (1982 - 2023)
Hoo's Listening
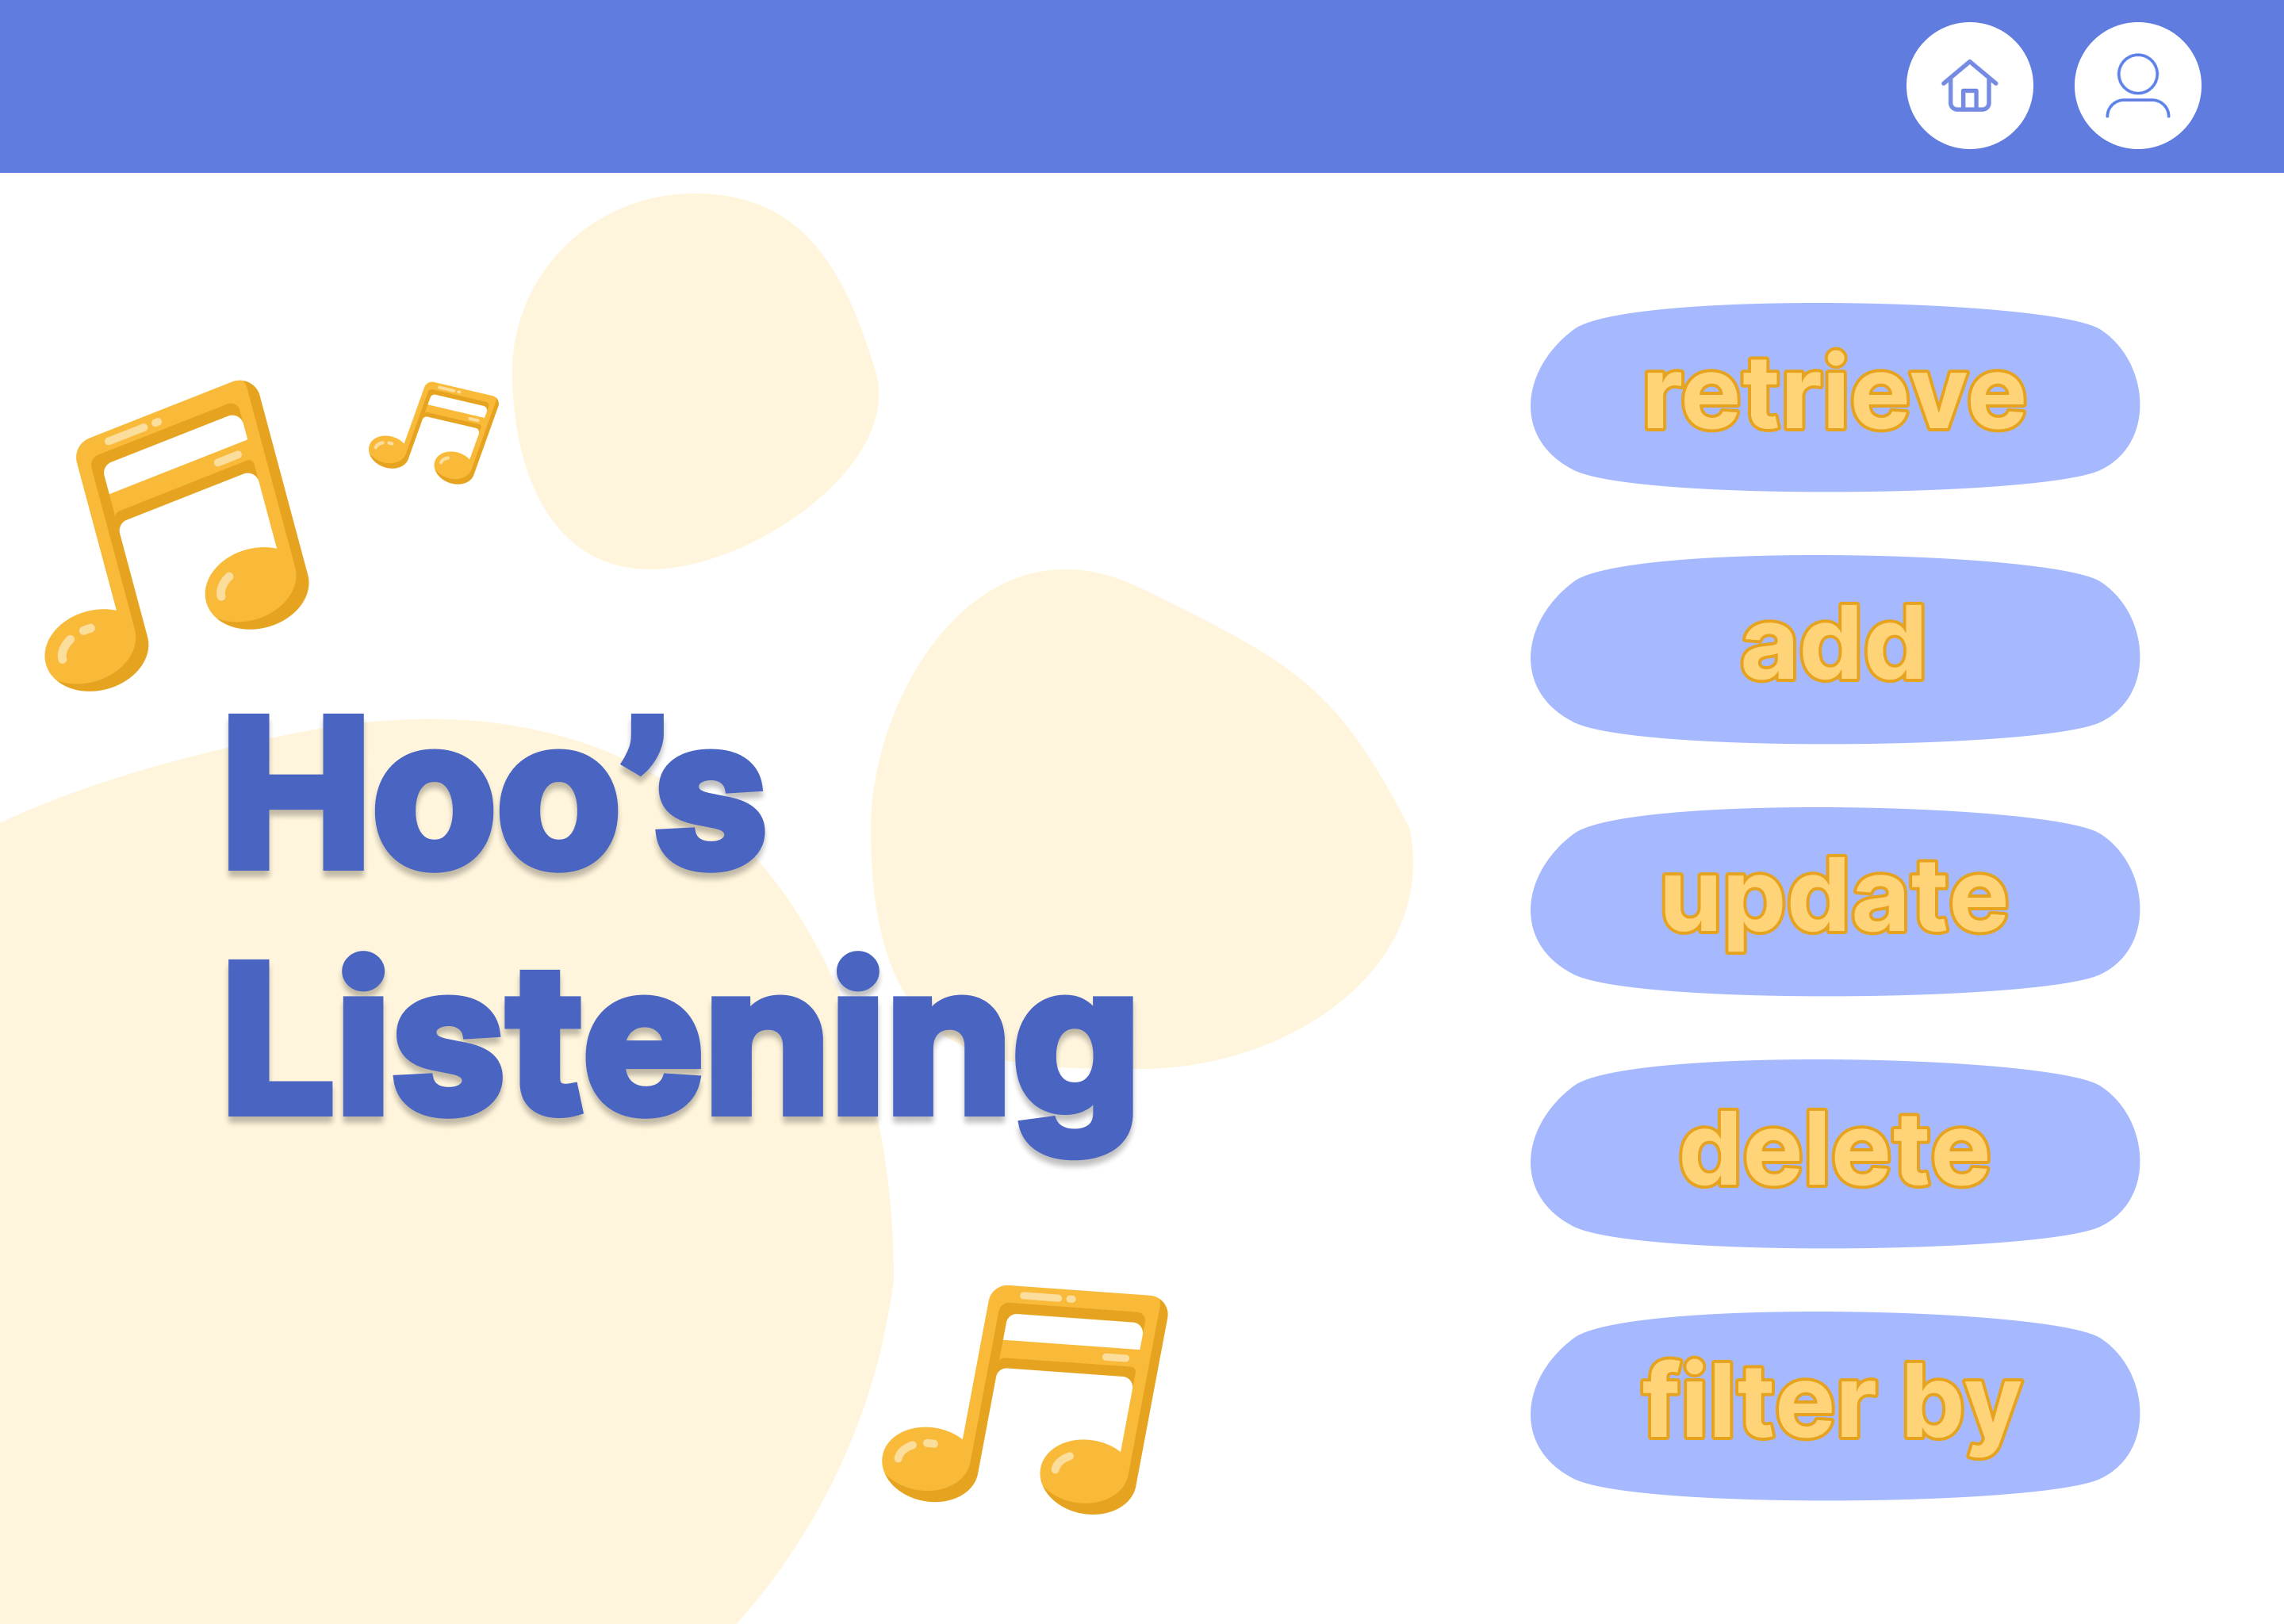
I developed a music sharing platform exclusively for the University of Virginia (UVA) community with my teammates, where users can retrieve, add, update, delete, sort, and 'like' songs based on their preferences. The database stores song details, including title, artist name, genre, album, release year, lyrics language, collaborations, and 'liked' timestamps by UVA users. To ensure efficient data management, we employ E-R modeling, adhere to Third Normal Form (3NF) and Boyce-Codd Normal Form (BCNF) standards, and design user-friendly interfaces using Figma that adapt seamlessly to various screen sizes.
Our platform's database is hosted on Google Cloud, ensuring security and scalability, and our app is hosted in our local environment with XAMPP. Furthermore, Python scripts is used to fetch data from the Spotify API, maintaining an up-to-date music library. This music sharing platform aims to enrich the musical journeys of UVA community members while fostering a sense of community through shared musical experiences.
Learn more about the project from the final report: Hoo's Listening Final Report
Burley Middle School Restoration Project
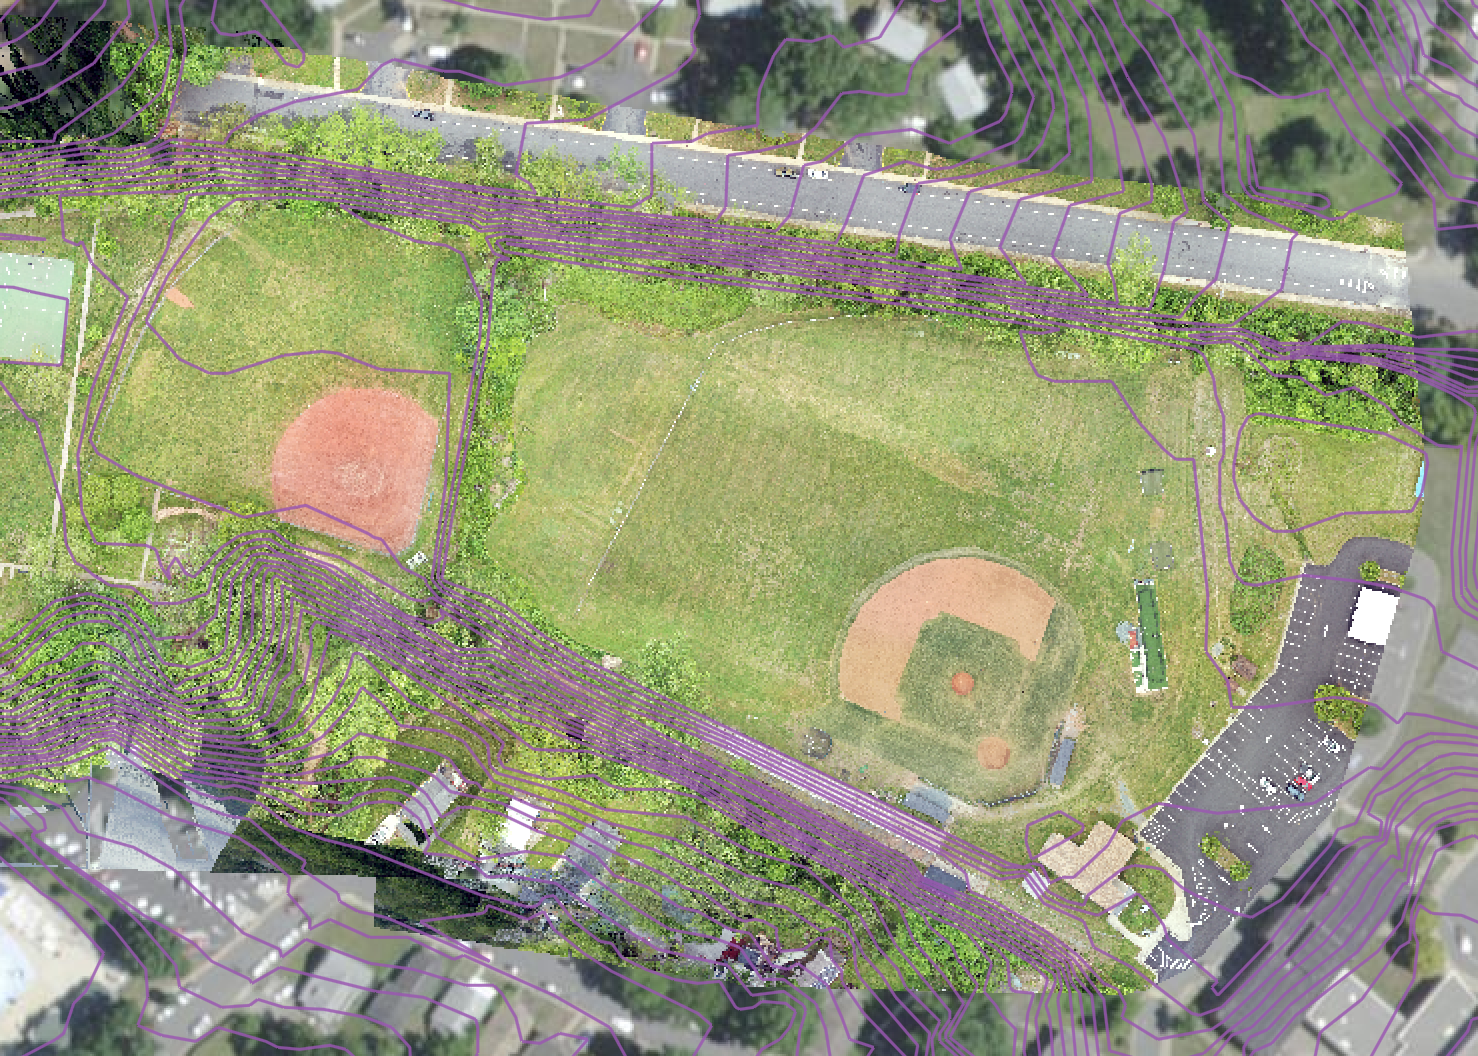
In this restoration project, I recommended the school to build solar panel around their baseball field based on my research and analysis. I utilized ArcGIS to create two interactive, multi-layered maps of the Burley Middle School terrain with my teammates, showcasing variations in solar radiation and land contours derived from drone imagery. These maps are instrumental in illustrating the disparities in critical environmental factors.
To effectively communicate our findings and recommendations, I embedded the maps into a StoryMap presentation. This allow us to succinctly summarize a comprehensive report advocating for the installation of solar panels in proximity to the baseball field. The insights are derived from in-depth geospatial data analysis, providing a compelling case for sustainable energy solutions at Burley Middle School.
Learn more about the project from the StoryMap: GIS Analysis of Burley Site